
5 Best Sports Club Management Software: Features, Pricing & ReviewsDecember 8, 2025
The 7 Best Youth Sports Team Management Apps for CoachesMarch 23, 2026
5 Best Sports Team Management Apps in 2026January 13, 2026
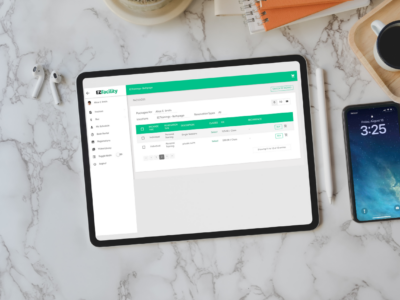


Best Sports Facility Management Software: 8 Tools to Organize Bookings, Memberships, and Revenue
Between back‑to‑back practices, league games, private rentals, and memberships to manage, it only takes one…

AI Is Changing How We Build — What That Means for EZFacility
Author: Mike Vidal, General Manager @ EZFacility Earlier this quarter, I had the opportunity to attend the…
")
The 7 Best Youth Sports Team Management Apps for Coaches
Coaching a youth team usually means doing two jobs at once: coaching the sport and…

5 Best Basketball League Schedule Makers: Full 2026 Guide
A basketball league schedule maker automates game rotation, handles uneven team counts, adjusts for court…
5 Best Sports Team Management Apps in 2026
Schedules need frequent updates, messages are shared across multiple channels, attendance has to be tracked…
")
The Future of Sports Facility Management: Trends, Technology, and Strategies for 2026 and Beyond
Running a sports facility is about efficiency, automation, and fan experience, all driven by technology.…

The New Year Brings New Opportunities at EZFacility
As a new year begins, businesses across the sports, fitness, and recreation industries look for…

5 Best Sports Club Management Software: Features, Pricing & Reviews
Most sports clubs run into the same problem as they grow: the admin keeps expanding…

Grow Your Sports Club With the Right Management Software
TL;DR: Managing a sports club often means juggling schedules, payments, renewals, and member communication, all…
")
Sports Facility Management Metrics & KPIs Guide
Whether it’s a community recreation center, a private training facility, or a multi-field complex, every…

EZFacility: Dark Mode is Officially Here
You asked, and we listened. This October, EZFacility launched Dark Mode, a new way to experience the EZFacility User Interface (EZUI) that…

Q3 Highlights: Chicago, Collaboration, and Customer Love
In July, our team gathered in Chicago to collaborate with department heads and map out new ways…

Managing a Sports Facility in a Competitive Market
Indoor sports facilities are in high demand. From batting cages and indoor baseball fields to…

Talkin’ Turf: Soccer Field Turf Management and Maintenance for Facility Operators
It’s no secret that operating a sports facility is challenging. Whether it’s an indoor or…

Solving the Sports League Scheduling Problem
If you've ever tried to organize a sports league, you know the sports league scheduling…

How to Grow and Manage Sports Facility Memberships Effectively
Managing sports facility memberships is more than a backend task—it’s the backbone of long-term growth…

Baseball Field Management and Maintenance for Facility Operators
Nothing ruins game day like a waterlogged outfield or a double-booked diamond. Whether you’re managing…

Aim Higher: How Gun Ranges Can Hit Their Mark in Efficiency
Managing a gun range or shooting club involves juggling multiple responsibilities—from scheduling range time and…

5 Ways Smaller Studios Win Big: How EZFacility Powers Boutique Fitness Success
Running a successful boutique fitness studio isn’t just about offering great workouts—it’s about delivering a…

EZFacility Team Gathers in Cancun for Leadership Summit
This March, EZFacility’s departmental leaders from around the world convened in Cancun, Mexico, for a…